Downloading All Your Pictures From iPad or iPhone

I really disklike iTunes, it is the worst piece of software I have ever come accross.  I would say that Windows has been getting better and better. I had the following problem: I uploaded quite a few pictures via iTunes onto my iPad, just because its nice to look at pictures on that machine. However, the machine with which I did the syncing broke and needed repair and somehow, I forgot to save these pictures onto a  hard drive for backup. So the only place where these pictures now rest is on my iPad.

iTunes wont allow you to copy pictures on your iPad onto a machine (only the pictures that you atually take with the iPad). This is because, these pictures *should*  be on the machine with which you synced your iPad in the first place.

However, this was not true in my case anymore. Now you could either invest some money and purchase an app that allows you to copy your picture albums from the iPad onto a Windows machine.

There is e.g. CopyTrans Suite, which is a bit costly and in the version I tried, did not copy the full resolution of the pictures (which is a rip-off!).

So I was looking into a cheap and quick solution to get the original full resolution pictures down from my iPad.

Setting things up: installing free app “WiFi Photo”
This app basically makes your photo albums available on a local webserver. Once you start the app on the iPad, it tells you an URL to brows to on your local machine. There you can see all the pictures that are on your iPad.

Logo of the Wifi Transfer appYou could now use this app to manually download the pictures, however, it is limited to 100 pictures at once and you will not get the full resolution pictures if you do a batch download.

If you browse through the app, you will notice that the URL to the full resolution pictures has the following form:

http://192.168.1.6:15555/0/fr_564.jpg

where the “0” stands for the album ID. If you have, say 2 albums on the iPad, this would take values “0” or “1”. Images are stored as consecutive numbers in each album, so the following link would go to picture number 564 in full resolution in album 0. So we will exploit this structure to do an automated batch download.

Doing an automated batch download

First, in order for this to work you need to get a a local PHP installation up and running. If you are really lazy, you could just install XAMPP. However, you can implement the code in any other coding language, e.g. in R as well.

To download all the pictures, you need to adjust and run the following script

for($k=0;$k<=3;$k++) {

for($i=1;$i<=1000;$i++) {

//adjust this
$url = "http://192.168.1.9:15555/".$k."/fr_".$i.".jpg";

//adjust this
$fn = "C:/Dokumente und Einstellungen/Thiemo/Desktop/Kolumbien/".$k."-".$i.".jpg";

//to make sure you dont redownload a file already downloaded if you want
//to run the script several times
if(!file_exists($fn)) {
if($content = file_get_contents($url)) {
$fp = fopen($fn,"a+");
fwrite($fp, $content);
fclose($fp);
}
}
}
What this script does it iterates through the albums (the first loop), in my case I have four albums. The second loop then iterates through the pictures, I simply assume that there are at most 1000 pictures in each album. Clearly, this can be made smarter, i.e. automatically find out how many pictures in each album, but this works and thats all we need.
I would recommend running the script a few times, as sometimes it is not able to retrieve the content and then, no file is created. By adding the “file_exists” check, I make sure that no picture, that has been downloaded already, is downloaded again. So if you run the script several times, it will be quicker and quicker to also pick up the last missing pictures.
Running the script takes some time as it needs to copy down each picture, and in my case this were a rough 2000 pictures. But now, they are back in the safe haven of my local machine.

Internet Connection Sharing via Ad-Hoc network for iPhone and iPad

As I have to be in hospital for a few days in Germany, I bought myself a SIM card and a month mobile internet flatrate. I have a netbook, a EEPC 1000go with an integrated mobile broadband card.

However, in hospital I rather wanted to use my iPad and my iPhone to read papers and so on. As both are from the UK and I have not unlocked them, I wanted to indirectly use the internet on these devices through my netbook. I was amazed by how quick and easy it was setting things up….

Continue reading Internet Connection Sharing via Ad-Hoc network for iPhone and iPad

Microfinance Map of India – another go…

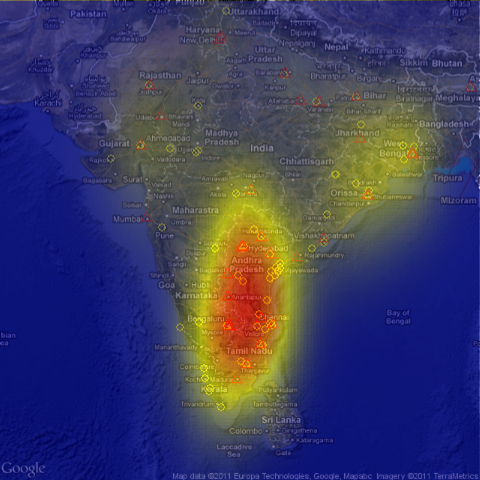
I gave it another go, trying to get a map that looks a bit nicer. This time, I tried to compute something like a density or intensity in a certain area. On the previous map, this was not visible very well. I used ggplot2 and a bit of R code, together with RGoogleMaps to produce the following picture:

This map displays the intensity of microfinance institution headquarter distribution across India. The data comes from the MIX Market.


The fact that many MFIs are clustered around in the south is highlighted quite strongly. What this graph does not take into account however, is their variable size. This is problematic and I agree that this needs further refinement, i.e. that the intensity takes into account how big an MFI is. However, I would conjecture that this merely makes the contrasts in such a map just stronger.


Microfinance in India: Getting a sense of the geographic distribution

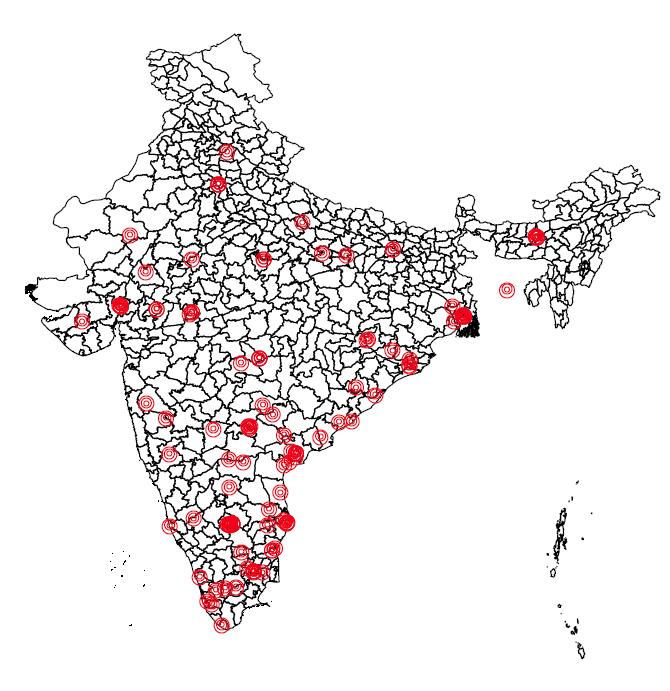
I am working on a review paper on microfinance in India and use data from the MIX market. Today, I was amazed by how quick I conjured a map of India with the headquarters of the microfinance institutions that report data to the MIX market depicted on that map. Ideally, I would have more geolocation data – but this is hard to come by. But what we can clearly see is the clustering of institutions in big cities and in the south, which was hit hardest by the recent crisis.

Microfinance Institutions across India


I dont think anybody has produced such a map before. In fact, I can do this for all institutions reporting data around the world, which may be interesting to see. Also, I already tried to make the size of the dot proportional to e.g. measures of real yield or color-coding the nearest neighborhood (say the neigbhouring districts) by the average loan sizes reported. Lots of things to do. Maybe thats something for the guys at MIX Market or for David Roodman who, I think has finished his open book.

The key difficulty was actually not in plotting the map (though it took some time), but in obtaining geo-data on where the headquarters of the microfinance institutions are located. I managed to obtain this data – though its not perfect – by making calls to the Google MAP API via a PHP script., basically using the following two functions:

Continue reading Microfinance in India: Getting a sense of the geographic distribution

Animation from Kiva data

I just came accross this amazing animation, which depicts lending flows from Kiva lenders to Kiva borrowers in the field. I have been working on a few pieces of research with my colleague Jon de Quidt using Kiva data. However, that work has stalled a bit as prioritization moved it towards the end of the queue. However, this animization is indeed inspiring and it is somewhat awaking the urge in me, not to wait too long to continue work on Kiva.


Intercontinental Ballistic Microfinance from Kiva Microfunds on Vimeo.

On another note, I am going to try to do some more work with R on mapping data, trying out several packages:

I found working with ArcGIS way too clumsy…


R Function Binding Vectors and Matrices of Variable Length, bug fixed

Now this is something very geeky, but useful. I had to bind two matrices or vectors together to become a bigger matrix. However, they need not have the same number of rows or even the same row names.

The standard cbind() functions require the vectors or matrices to be compatible. The matching is “stupid”, in the sense that it ignores any order or assumes that the elements which are to be joined into a matrix have the same row names. This, of course, need not be the case. A classical merge command would fail here, as we dont really know what to merge by and what to merge on.

Ok… I am not being clear here. Suppose you want to merge two vectors

A 2
B 4
C 3

and

G 2
B 1
C 3
E 1

now the resulting matrix should be

A  2  NA
B  4  1
C  3  3
E NA  1
G NA  2

Now the following Rfunction allows you to do this. It is important however, that you assign rownames to the objects to be merged (the A,B,C,E,G in the example), as it does matching on these.

cbindM <-
function(A, v, repl=NA) {

  dif <- setdiff(union(rownames(A),rownames(v)),intersect(rownames(A),rownames(v)))
#if names is the same, then a simple cbind will do
    if(length(dif)==0) {

      A<- cbind(A,v[match(rownames(A),rownames(v))])

        rownames(A) <- rownames(v)

    }    else if(length(dif)>0) {#sets are not equal, so either matrix is longer / shorter

#this tells us which elements in dif are part of A (and of v) respectively      
      for(i in dif)     {

        if(is.element(i,rownames(A))) {
#element is in A but not in v, so add it to v and then a        

          temp<-matrix(data =repl, nrow = 1, ncol = ncol(v), byrow = FALSE, dimnames =list(i))
            v <- rbind(v,temp)

        } else {
# element is in v but not in A, so add it to A

          temp<-matrix(data = repl, nrow = 1, ncol = ncol(A), byrow = FALSE, dimnames =list(i))
            A<-rbind(A,temp)
        }
      }


      A<-cbind(A,v[match(rownames(A),rownames(v))])

    }

  A
}

Note: 09.11.2011: I fixed a bug and added a bit more functionality. You can now tell it, with what you want the missing data to be replaced. Its standard to replace it with NA but you could change it to anything you want.


London Riots : Catch the Looters!

Today we were told to leave office early:

Hi All

Due to anticipated rioting in the Tottenham Court Road area this evening, businesses in the area are being advised to close at 5pm. So I would recommend that we go along with this as well and try to finish up as close to 5pm as possible. Last access to and from this building today will be at 7pm.
So far, its still quiet.  In the meantime, Catch the Looters!

Back in London – really!

I just returned to London after 3 1/2 weeks in London. And what a return it was. I finally passed all the exams needed and I can now focus fully on my Phd. That was about the good news!

Of course, London greeted me with a Sunny morning but it would end up hitting me hard with rain later that day. And that was after bad news from our advisors and supervisors that our work ok Kiva is most likely in vain as we would never really get it published in a really good journal.

So we will see, the other projects are still up and running, but I need to get an idea for a joan Market paper sometime soon. I am down for 2013/2014 as the prospective year. Just two more years to go, exciting but a bit scary as well.

Impressions from Colombia

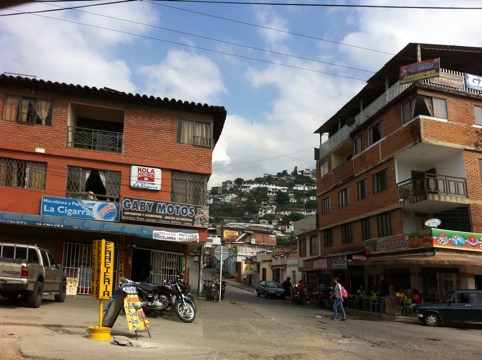
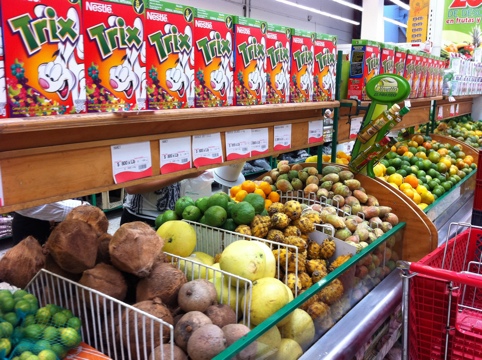
This summer, right after the examination period I travelled to Colombia. Flying to Bogota and then onwards to Cali, where my girlfriends mother lives, I got to know a remarkable country that was ridden by violence and conflict for a long time.

I was amazed to see how the private initiative of this energetic people start to transform and reshape the country.

Most of the 3 1/2 weeks I stayed in Colombia, I was in Cali, Cartagena on the Caribbean coast and in the countryside around Cali. I attach some of my impressions.

20110703-121637.jpg
20110703-121722.jpg
20110703-121744.jpg
20110703-121759.jpg

20110703-121915.jpg

Joint Liability Group Lending still very much present in Microfinance

I have been looking at data from the MIX market recently. They provide a lot of financial data from microfinance institutions around the world. This data is made accessible to donors, but especially to other financiers of microfinance. It has helped us in the understanding of the state of the microfinance world, as it has become a central gathering point for data.

In recent years, more and more institutions started to disclose data on lending methodology. There are three categories. First “Solidarity lending”. It is not 100% clear, but from the glossary of terms on the MIX market website, I assume it means classical joint liability lending groups (JL). The other categories are “Individual lending” (IL) and “Village Banking”. A lot of early theoretical work has focused on the role that joint liability group lending had in context of classical problems  of adverse selection, moral hazard and ex-post moral hazard (enforcement problems).

Though in 2002 Grameen officially abandoned explicit joint liability and other institutions, such as BancoSol seemed to follow. So one interesting question is, whether institutions are shifting away from Joint Liability groups towards more Individual lending, or whether our perceptions are biased because two popular institutions have abolished explicit joint liability.

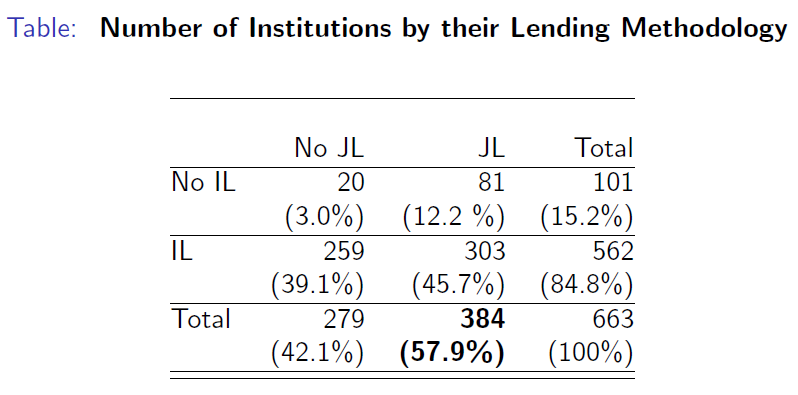
It turns out that in the MIX data for the year 2009, we observe that joint liability lending is still very much present. The following table tells us however, that a lot of institutions seem to offer both individual liability as well as joint liability loan products.

Number of Institutions by their Lending Method

The institutions recorded as “No JL” and “No IL” are falling into the category of “Villagebanks”.

I think it is interesting to try to understand the patterns, why so many institutions use both joint liability groups and individual liability lending methods at the same time. Are there clear patterns as to when which method is predominantly used? Are for-profits more likely to use individual lending? What are the effects of competition?

Some very simple questions, which need yet to be answered.

Margin Caps for the Microfinance Industry?

A lot of attention has been around the issue of interest rates charged by microfinance institutions. In his comment “Sacrificing Microcredit for Megaprofits” in the NYT Muhammad Yunus claims that with institutions such as SKS of India or Compartamos of Mexico going public, “microcredit would gave rise to its own breed of loan sharks.”

But what actually makes a lender a loan shark? The focus has been primarily on the interest rates charged. Yunus suggests a rule of thumb:

The maximum interest rate should not exceed the cost of the fund — meaning the cost that is incurred by the bank to procure the money to lend — plus 15 percent of the fund. That 15 percent goes to cover operational costs and contribute to profit. In the case of Grameen Bank, the cost of fund is 10 percent. So, the maximum interest rate could be 25 percent. However, we charge 20 percent to the borrowers. The ideal “spread” between the cost of the fund and the lending rate should be close to 10 percent.

This rule of thumb proves to be overly simplistic. It basically imposes a cost-target for lenders, suggesting that operational costs should be covered by a markup of 15% on the cost of raising funds. It has been noted that many institutions fall short of such a rule of thumb.

Continue reading Margin Caps for the Microfinance Industry?

Inequality and Growth: What Can the Data Say?

The attached PDF contains a summary of the article

Banerjee, A., Duflo, E. (2003), Journal of Economic Growth, Vol , pp. 267-299.

Abstract
This paper describes the correlations between inequality and the growth rates in cross-country data. Using non-parametric methods, we show that the growth rate is an inverted U-shaped function of net changes in inequality: changes in inequality (in any direction) are associated with reduced growth in the next period. The estimated relationship is robust to variations in control variables and estimation methods. This inverted U-curve is consistent with a simple political economy model but it could also reflect the nature of measurement errors, and, in general, efforts to interpret this evidence causally run into difficult identification problems. We show that this non-linearity is sufficient to explain why previous estimates of the relationship between the level of inequality and growth are so different from one another.

Continue reading Inequality and Growth: What Can the Data Say?